Overview
Liquid State's app analytics are a great evaluation tool for your app and app content.
With analytics, you can monitor your app’s usage and tweak your app strategy accordingly.
Some app analytics features are included as standard for every app created with Liquid State.
Enterprise users and power users who upgrade their Liquid State Cloud to a Ubiquity Dashboard are also provided with an upgraded actionable analytics dashboard.
| Info |
|---|
Interested in enabling powerful analytics for your apps? Get in touch with Liquid State Support. |
Analytics Overview
All analytics are held within the app-level Analytics tab.
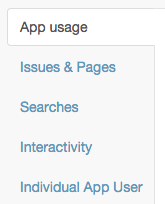
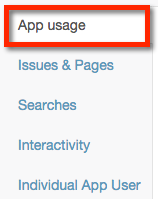
Within the Analytics tab, there are several sub-tabs that house analytics on particular app metrics.
| Info |
|---|
The available sub-tabs will vary depending on whether you are using a standard Liquid State Cloud account, or an enterprise-level Ubiquity account. |
Graphs, Tables, Lists & Details
Throughout the Analytics tab, there are a number of interactive graphs, tables, and lists.
| Info |
|---|
Additional interactive elements are enabled for users who have upgraded to Actionable Analytics |
Graphs
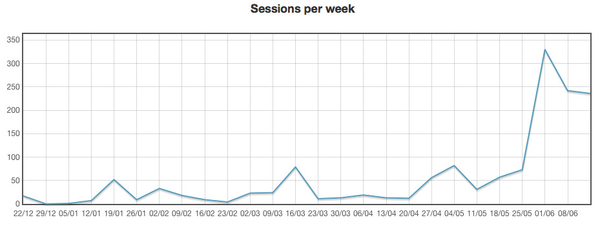
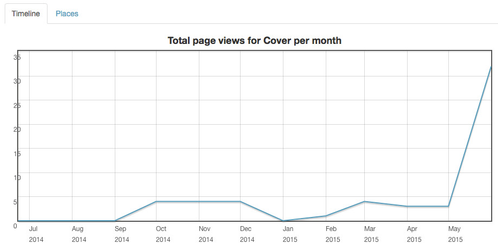
Graphs show an automatically generated visualisation of data for the metric you are viewing.
Tables
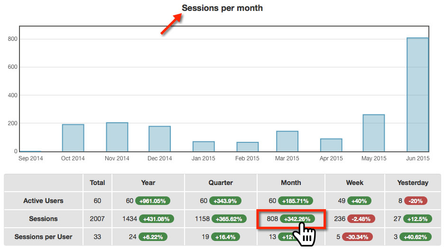
Tables show a granular breakdown of metrics over time.
Click a cell within a table to view a visualisation of that particular data.
Lists
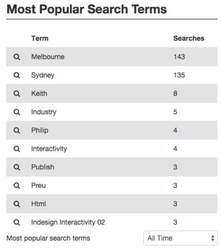
Scrollable lists are also displayed.
Use the available dropdown menus to refine list entry results.
Details
Click a list entry, or search, to view more details in the relevant Details section.
Details sections include timeline and places tabs, which allows you to see where and when a specific page or content has been accessed.
Standard App Analytics
The following metrics are included within Liquid State's standard analytics package.
App Usage
The App Usage sub-tab provides a general overview of how much your app is being used.
View information on Active Users, Sessions, and Sessions per User over different time periods.
| Info |
|---|
The Active Users and Sessions per User metrics will only display relevant information for private apps that have app user login enabled. |
Content & Pages
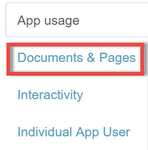
The Document & Pages sub-tab allows you to view analytics for content within your app, and individual pages within your content.
This sub-tab houses an interactive graph and table for Total documents viewed, Unique documents viewed, Total page views, and Unique page views over time.
A list of the Most Popular Documents and Pages within your app is also displayed, with a related Documents and Pages Details section.
Key Definitions
Total documents viewed:
The total number of times any document was viewed within the selected time period.
For example, if you had 2 documents in your app, and each of them had been viewed 10 times, your Total documents viewed would be 20.
Unique documents viewed:
The number of Documents in your app that have been viewed within the selected time period.
For example, if you have a total of 30 documents that were published in the app within a time period, the maximum potential for number of Unique documents viewed would be 30.
Total page views:
As per Total document views, but per page.
One document in the app can have multiple pages. You can navigate between pages by swiping left or right while reading a document.
Unique page views:
As per Unique document views, but per page.
Actionable Analytics
Actionable Analytics allow you to directly act upon the information provided to you in your Analytics tab.
These advanced features are only available to advanced Liquid State Ubiquity users.
| Info |
|---|
Interested in enabling powerful analytics for your apps? Get in touch with Liquid State Support. |
Actionable Analytics include all standard app analytics metrics, plus the additional metrics and sections listed below.
Documents & Pages Tab
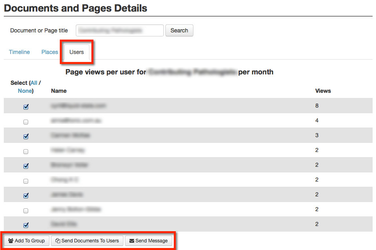
The Documents and Pages Details section within the Documents & Pages sub-tab displays an additional Users tab.
Access this tab to select one or more registered app users who have viewed a page/document, then take an action such as adding them to a group, sending them a message (push notification), or distributing documents to them.
Searches
The Searches sub-tab contains metrics based on searches conducted within your app.
| Info |
|---|
The Searches sub-tab is only available for apps which have live text within their content, and search functionality enabled. Interested in enabling search for your apps? Get in touch with Liquid State Support. |
The Searches sub-tab includes three sections: a General Search Details table and graph, a Most Popular Search Terms list, and a Search Term Details section.
The Search Term Details section can be used to add app users to a group, send them a message (push notification), or distribute documents to them.
Interactivity
The Interactivity sub-tab contains metrics on the interactive elements within your app.
There are three sections within the Interactivity sub-tab: App-based Interactivity, Content-based Interactivity, and Most Popular Interactions.
App-based Interactivity
Contains a table of metrics based on user interactions with app based functions, such as table of contents and reading history.
Content-based Interactivity
Contains a table of metrics based on user interactions with content based functions, such as links, image browsers, and files.
Most Popular Interactions
Contains a list of the most popular interactive elements within your app, over time.
Click through the sub-tabs to view metrics on a range of specific types of interactivity.
Individual App User
| Info |
|---|
The Individual App User section is only applicable to private apps with app user login enabled. |
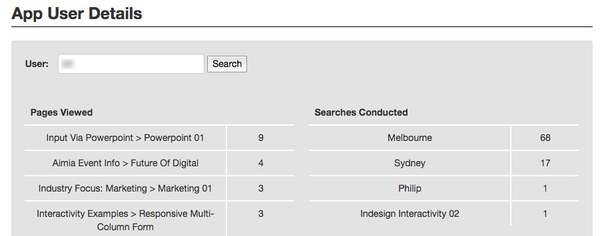
The Individual App User sub-tab contains an App User Details section.
Use the search bar to identify an individual app user.
You can then see the Pages Viewed and Searches Conducted by the user.
| Info |
|---|
The Searches Conducted list is only available for apps which have live text within their content, and search functionality enabled. Interested in enabling search for your apps? Get in touch with Liquid State Support. |

